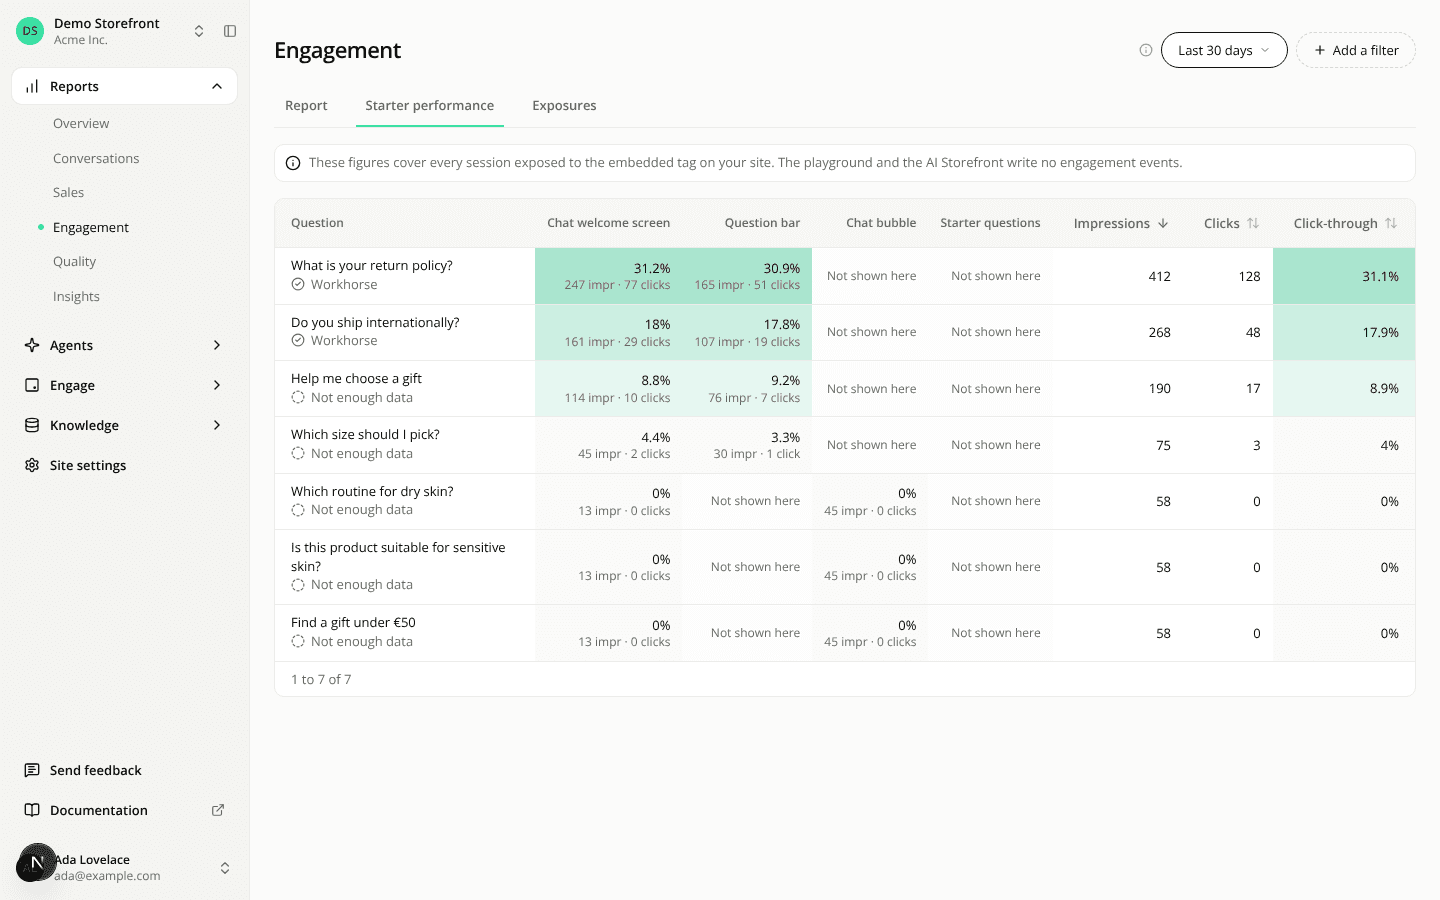
The Engagement report splits into three tabs, and the starter table gets sorting and pages
ChangedThe Engagement report was one long page. It now has three tabs under its title.
- Report: the KPIs, the charts, the per-widget and per-device tables and the page-type bar. The two long tables that used to sit at the bottom are gone from this page.
- Starter performance: the table of starter questions that was at the bottom of the report, now on its own page.
- Exposures: the raw exposure events. This page already existed. It is now a tab, and the See all link on the report is gone because the tab replaces it.
Starter performance is sortable and paged. Click Impressions, Clicks or Click-through to sort the whole table, not only the rows on screen. The default is impressions, largest first. The table shows 50 questions per page with Previous and Next. The sort and the page are in the address, so a link keeps them.
Period and device. The tabs read the same date range and Device selection from the filter bar, which remembers them in your browser. The comparison with the previous period stays on the Report tab only.
Nothing else changes in the figures. Questions never shown in the period still have no row.
Resources