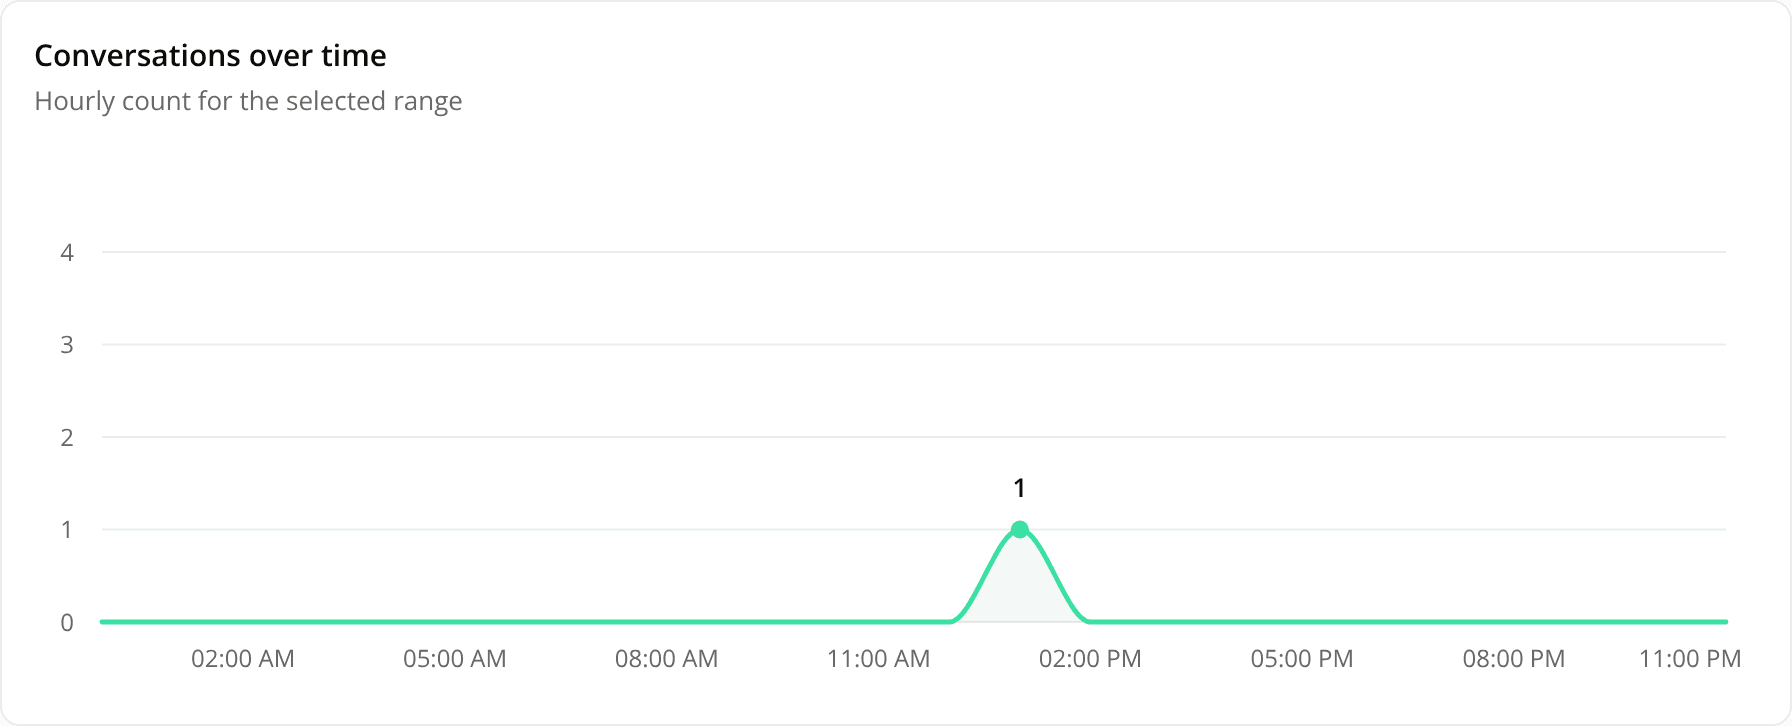
Report charts read per hour on a period of one or two days
ChangedOn Today, Yesterday or any range of two calendar days or fewer, the volume charts now plot one point per hour instead of a single point per day. You see when the day's conversations, widget events and ratings happened. A longer range stays daily.
- Conversations over time (Insights), Engagement over time and Feedback over time (Quality) all follow this rule.
- Hours are shown in the time zone saved in your preferences. The period itself is still whole UTC days.
- On a range that includes today, hours that haven't started yet have no value rather than showing zero.
- With Compare to previous period on, the dashed overlay on the conversations chart is hourly too.
If you read reports through the MCP server, the volume field of get_report changed shape for the conversations, quality and engagement reports. It now carries a granularity (day or hour), and the quality and engagement series moved under points. This breaks a client that read volume as an array. We know of no such client.
Resources