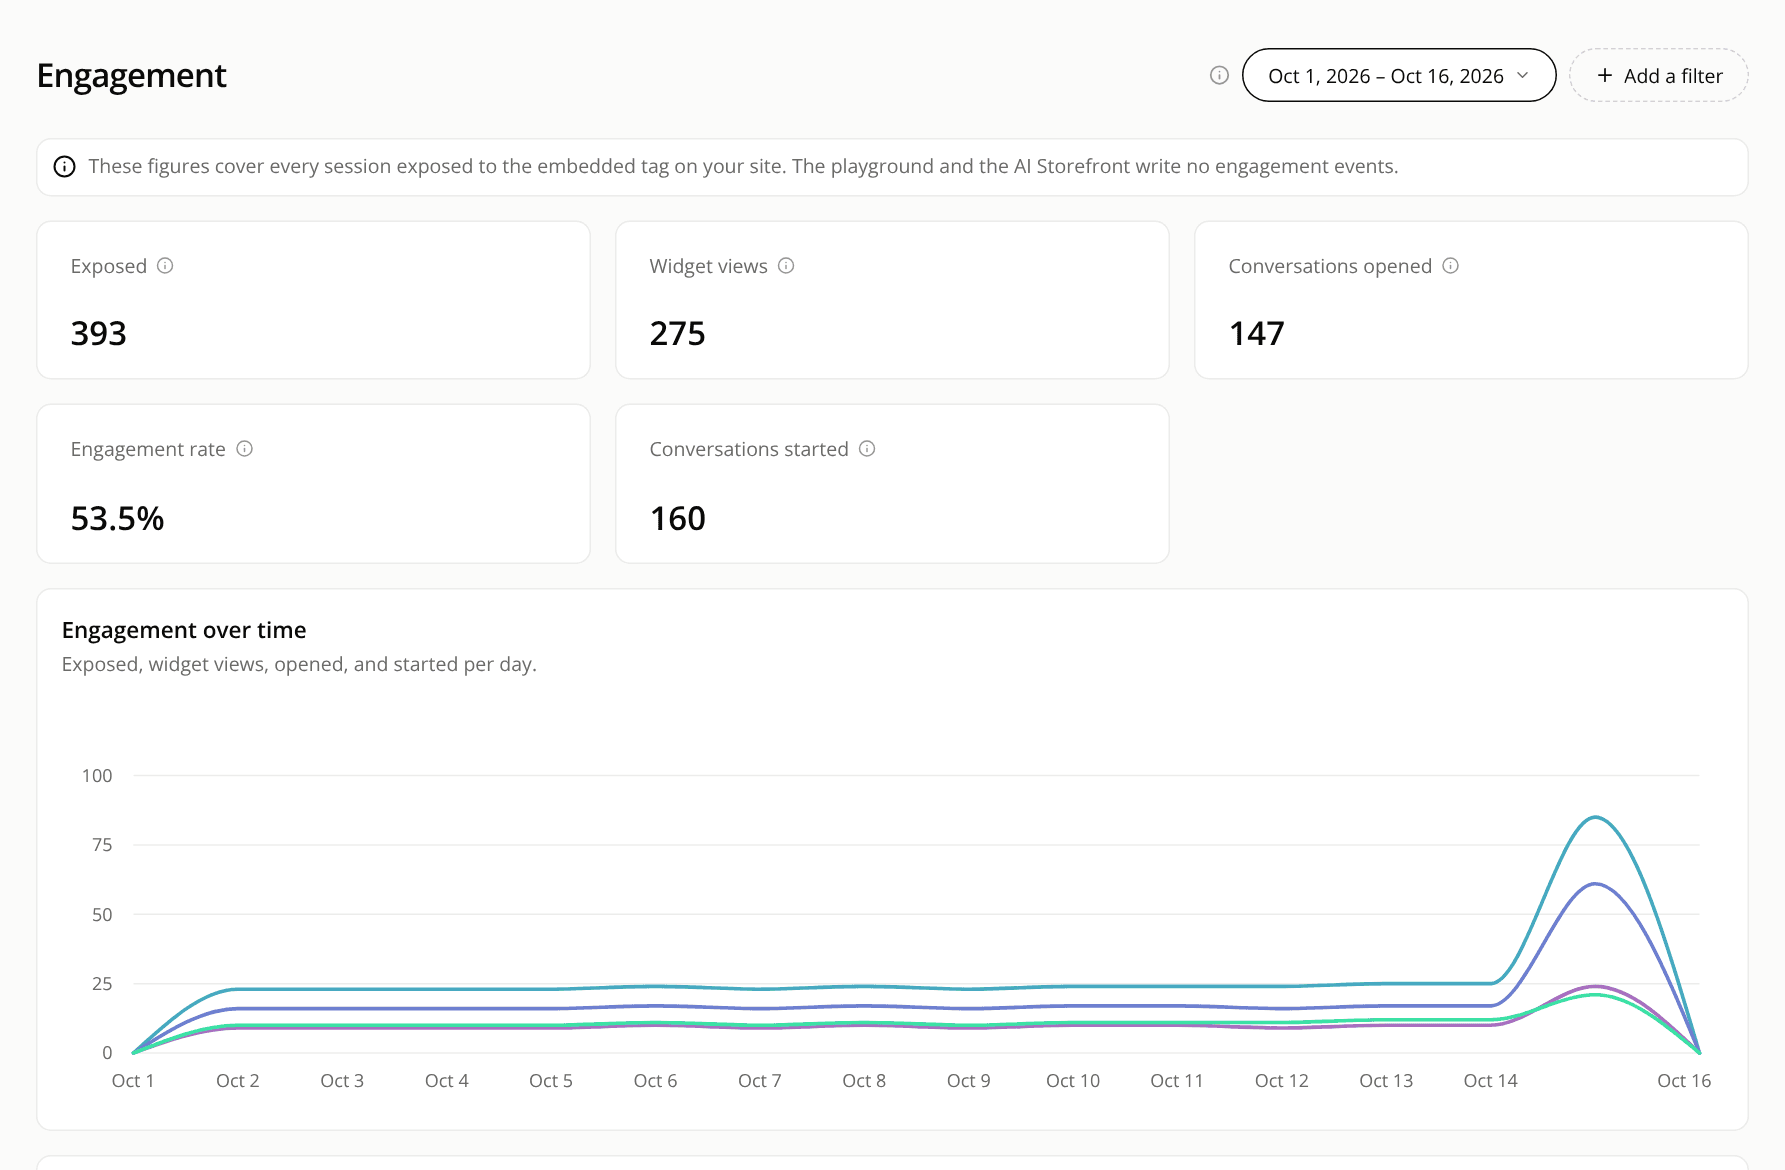
One engagement rate, everywhere
ChangedThe product showed the engagement rate with two different formulas and three names. It now has one definition and one name on every screen.
The definition. The engagement rate is the sessions that saw a widget and opened the conversation from it, divided by the sessions that saw a widget. Both sides count distinct sessions.
It replaces both old formulas. The site tiles (Overview and Engagement), the by-device card and the MCP get_report tool used started over exposed. The per-widget table, the widgets list and a widget's Performance tab used started over views and called it "Start rate". All of them now show the engagement rate. This also reverses the earlier change that moved the headline rate from opened to started.
One decimal, rounded up. A rate of 7.01% reads 7.1%. Changes against the previous period are in points with one decimal, computed on the rates shown: 7.1% to 7.4% reads +0.3 pts.
What it means for your figures. Existing rates move, and a series that spans today shifts at that point. Nothing is recomputed or backfilled: every figure is calculated from your events when you open the page. A range with no widget view shows a dash, not 0%.
Other changes you will see.
- The by-device card now shows Views, Opened and Engagement rate.
- The Conversations started tile stays, with its "Not tracked before this range" notice. The rate no longer has that gap.
- Conversations opened counts sessions that opened from a widget. It can sit slightly above the rate's numerator when a view was not recorded.
- In
get_report,engagementRateis the unrounded ratio, the summary gainsengaged, and eachbyDeviceentry is{device, views, opened, engagementRate}.
Unchanged. A/B tests still measure conversations started over assigned sessions, not the engagement rate. The starter-question click-through rate is unchanged: a click is a conversation started from that question.
Resources