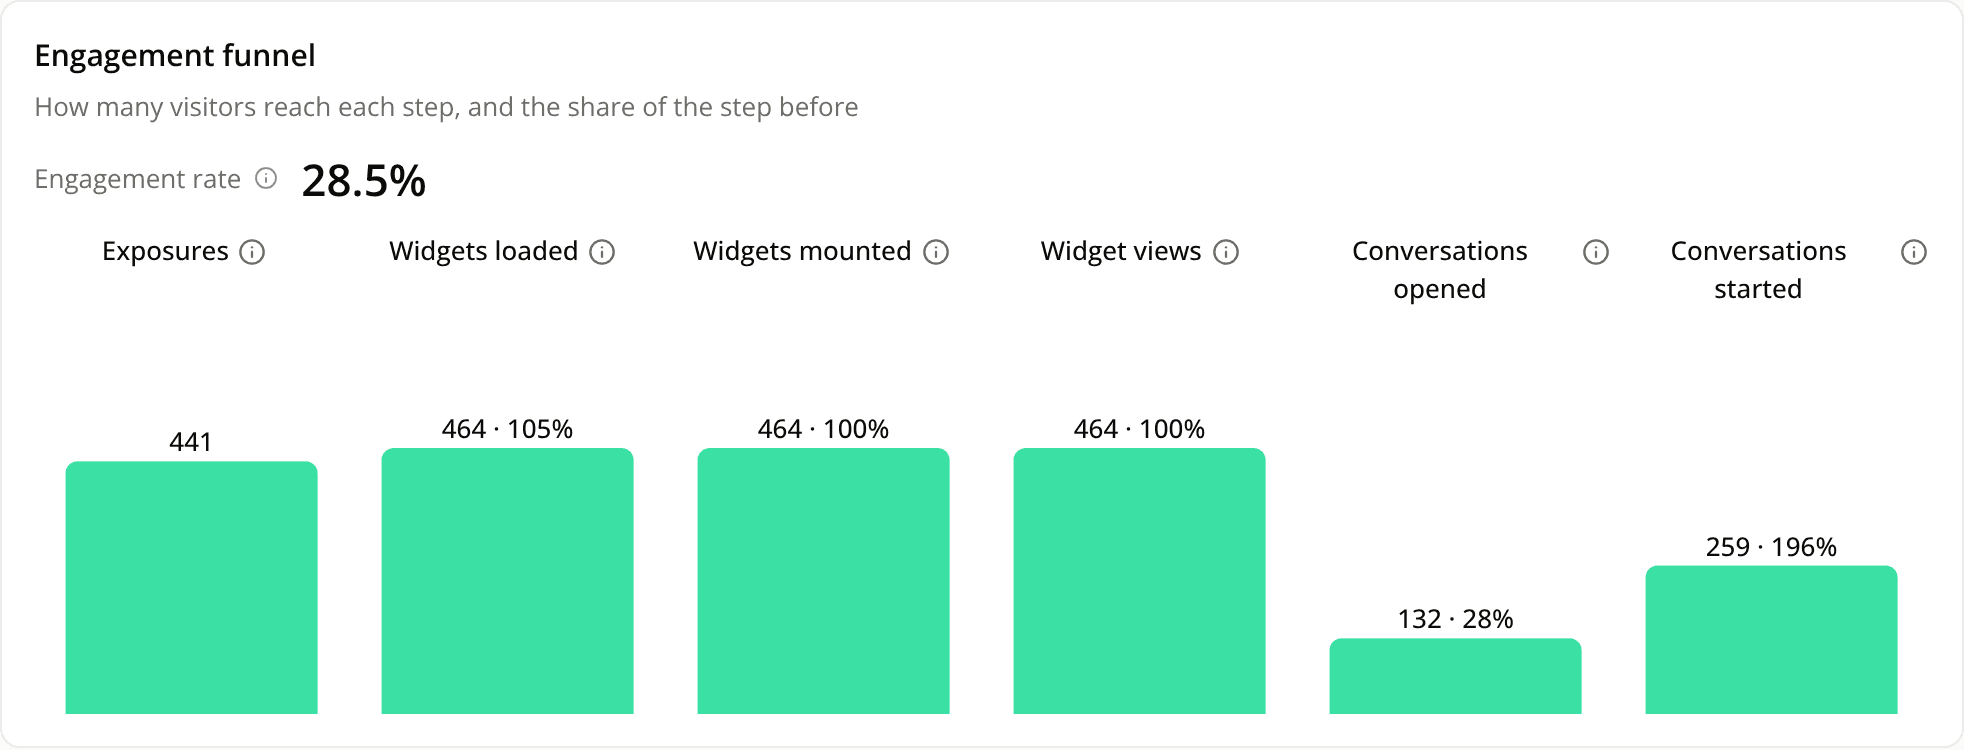
The Engagement report opens on a funnel
ChangedThe Report tab of the Engagement report now opens on an Engagement funnel. It replaces the seven technical tiles with six figures, in the order a visitor reaches them:
- Exposures: the script ran on a page of the site.
- Widgets loaded: the widget is configured and could show on the page.
- Widgets mounted: the spot for the widget exists in the page.
- Widget views: the visitor saw the widget on screen.
- Conversations opened: the visitor opened the chat from the widget.
- Conversations started: the visitor sent a first message.
Each figure shows its share of exposures on its bar. The tooltip also gives its share of the step before. Select the i beside a figure to read its definition.
The engagement rate stays beside the funnel, with the same definition as before.
A figure can be higher than the one above it. An ad blocker can stop the script without stopping the widget, and a chat can start without a widget, such as from a button on the page. In both cases the report shows the figure as measured, and a note appears when you hover over that step's bar.
The change badges under the seven tiles are gone, so the stages no longer show a change against the previous period. The engagement rate keeps its change. The Exposures tab and the events the tag records are the same.
Resources